Why Location Is The Single Most Important Factor When Buying An Investment Property
by Jane Slack-Smith

by Jane Slack-Smith
After observing thousands of investors, I find that the #1 most common mistake investors make is:
They invest in the wrong suburbs.
I call these under-performing suburbs “Portfolio Killers”, because these suburbs simply DO NOT have the characteristics of investment grade suburbs.
So WHY ON EARTH do people choose to invest in these portfolio-killing areas?
When I am approached by would-be investors (almost daily since the release of my book), the first thing I ask them is: “How do you go about choosing your location?”
And sometimes I’m horrified to hear responses like:
“A friend of mine gave me a great tip at a BBQ…”
“My hairdresser’s son is a real estate agent and he said the area was up-and-coming…”
“We just looked at areas within a 20-minute drive that we could afford…”
“I drove past it one day and I just got ‘the feeling’…”
And my favourite…
“We just looked in our own neighbourhood because we know the area really well, so it made complete sense…”
And I say:
“How well do you really know the area?”
Have you really done the proper analysis? Have you analysed the area like an investor?
I ask them:
– What was its capital growth last year?
– What is its current rental yield?
– What’s the percentage of renters or the demand for rental properties?
– Have you compared it to other suburbs?
And almost always, they can’t answer these very simple questions.
Now, this is not what I want for you! Because this is a good recipe for investing in under-performing suburbs (“Portfolio Killers”).
Instead, I’d like to introduce you to a proven system for pinpointing precisely which suburbs to invest in, so you can keep purchasing properties and growing your portfolio with absolute confidence (and minimal risk).

When I first started investing in property 15 years ago, I entered the market, in the same way I would enter a mine site (I was an explosives engineer), with one thing in my mind – avoid risk.
I didn’t decide to get into property investment because I wanted a house with a picket fence. I chose property because I wanted to find a way to make my money work for me. At that time, I was working in the mines, exchanging my time for money and risking my life every single day. I needed a way to get out.
I tried to learn everything I possibly could about property investment and studied hundreds and hundreds of books, reports, data and statistics, and I realised one thing: There is a formula to achieving a successful property portfolio and it can be replicated.
At the centre of the formula, I discovered one key element – location.
Location determines the success of building your property portfolio and ultimately reaching your financial goals.
So, with that in mind, let’s take a look at how to invest in the right location.
Whenever I am looking at a new property, I go through the following 5 steps to see whether or not it suits the right criteria.
I built my own multi-million-dollar property portfolio in under 10 years, and these days I’m passionate about helping everyday Australians achieve financial freedom through accelerated, low-risk, property investment.
That’s why I highly encourage you to read on and discover the 5 steps that reveal exactly where to buy.

Smart investors think long term and they start with a clearly defined destination or goal.
They establish a goal, a time frame to achieve that goal, and a game plan to get them there.
Follow this time-honoured principle and you will be able to put every single investment decision against the simple test: “Does it get you to your end goal in the required timeframe?”
Now, you can think of your goal in 2 parts:
1) Your destination or goal: What would you like your life to look like and by when?
2) How much money do you need to make that a reality?
Financial goal
We like to work this out as an annual figure and then we can work backwards from there.
Once you are clear on your financial goal and what you want your life to look like, then you can select the property investment strategy to make that happen.
There are many different types of investors and many different investment strategies. So how do you select the right strategy for you and avoid choosing a strategy that is unmatched to your circumstances?
When it comes to deciding which strategy is the right one for you, there are many strong opinions, competing strategies and seemingly endless paths that you can go through.
So, what is a property strategy?
Well, simply put, a property strategy is just a tool.
A tool to get you to your financial goal within the desired timeframe.
So, to give you an example, we typically work with investors who have a financial goal of between $50,000 – $150,000 in passive income within a 10- to 15-year timeframe.
That’s the end goal and the timeframe.
You then choose the strategy that would be the right tool for the job.
What’s great is that once you’ve decided on your goal and your strategy (the tool that you are going to use), you will also have real clarity on exactly which areas you need to target.
Our clients typically have a financial goal of between $50,000 – $150,000 in passive income within a 10- to 15-year timeframe, and the tool we use and recommend is a capital growth strategy.
Now that our goal and our strategy are completely aligned…
We start looking at specific locations with the characteristics that will return us the highest capital growth performance possible for that purchase price and within that specific time frame.
The good news is these characteristics are known and you can learn them too!

Next, we start creating your initial suburb shortlist of areas that are suited to your financial goals and property investment strategy.
Through a structured process of analysis and elimination, you will be able to identify the suburbs that have the greatest potential for capital growth and other individual characteristics that match your specific criteria.
Our aim is to choose an area that is undergoing pricing pressure from neighbouring areas. This pricing pressure is often referred to as “the ripple effect “.
The ripple effect refers to capital growth spilling over from the high-demand (in-demand) suburbs to the neighbouring areas.
Essentially we are looking for a suburb that is next to or near a suburb that has experienced sustained capital growth. Consider it the “next best option”. It has similar qualities to the booming suburb but is yet to really spark up.
The 2% increment rule is the further narrowing of the ripple effect criteria: It is a calculation based on a suburb’s historical performance. You want to focus on suburbs that have an incremental difference of at least 2% ten-year average capital growth, compared to neighbouring suburbs.
The faster growing neighbouring suburbs (that we want to buy alongside of) can often be found closer to the CBD, road infrastructure and coastline.
One of the best techniques for discovering the Ripple Effect is creating a Dot Map (invented by Medine Simmons).
The reason I love this as a technique is that it’s very inexpensive to make and anyone can do it!

The Dot Map is designed to uncover the Ripple Effect. This effect is evident when certain suburbs or areas have experienced highly sustained growth over a 10-year period and may have created a squeeze effect onto their neighboring suburbs.
By looking at these neighbouring suburbs (which you can afford), you are, in effect, researching the next great area that will grow in value.
To make a dot map, you will need:
1) A large map of the city or state you are researching.
This map shown in the course video is called the “Melbourne Municipal and Postcode Map” and was ordered online from retailer Mapworks. Other map suppliers are also available around Australia.

2) Semi-transparent coloured stickers or highlighters to indicate past growth figures. You can also use different colour highlighter pens to complete this exercise.

3) The past 10-year average growth data from the data section (at the back) of Your Investment Property Magazine. This is called “annual growth”.
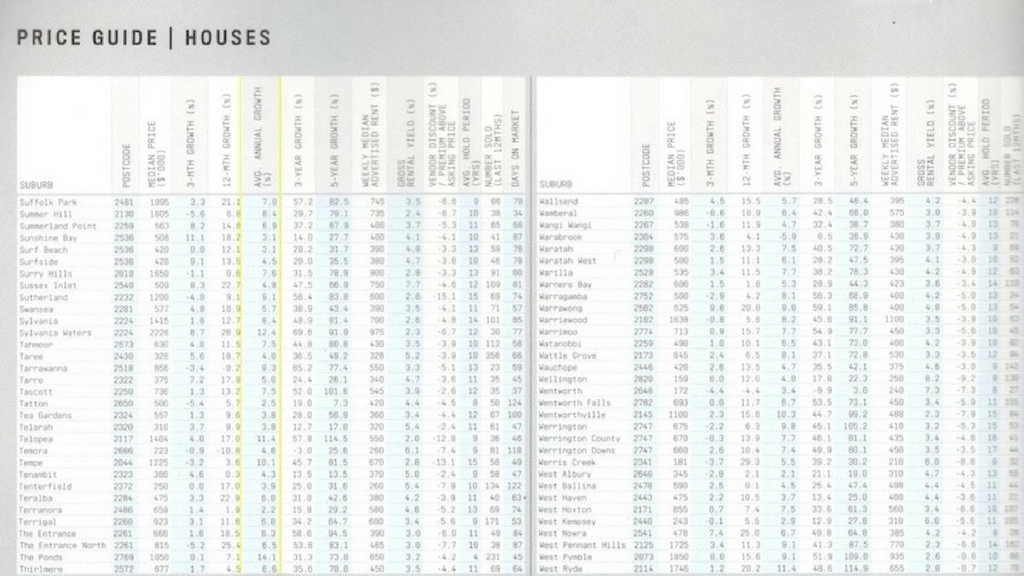
We have chosen to use the measure of 10-year average capital growth because it is not affected by the short-term factors and is, in my opinion, the most reliable data to use for this exercise.
4) Establish the % growth data ranges that you will use to plot the past capital growth. Be sure to have a quick look at what the suburb ranges are first for a guide.
Choose a colour that represents each growth range.
5) Record each suburb’s past 10-year capital growth figure from the magazine data and place a corresponding coloured dot on the suburb.
6) Hang your map on a wall, step back and admire your work.
Do you see any patterns?
Look for suburbs that have neighbouring suburbs with higher past capital growth by two increments or greater.
Create a short summary of your findings by recording the following:
There are approximately ____ suburbs that have neighbouring suburbs with higher 10-year growth by two increments or above.
7) Look for suburbs that have neighbouring suburbs with higher past capital growth by one increment or greater.
Create a short summary of your findings by recording the following:
There are approximately _____ suburbs that have neighbouring suburbs with higher 10-year growth by one increment or above.

It’s critical that the areas you’re considering correctly match your property investment strategy.
As discussed in the introduction, the strategy that we ourselves use and recommend to others is a capital growth strategy.
Therefore, our search concentrates on the specific locations with the characteristics that suit our strategy.
A basic principle of economics is supply and demand. Yet surprisingly, few property investors take the time to find out whether or not demand exists within an area for their strategy.
If we look at the Australian property market as a whole, approximately 70% of the market is homeowners.
This statistic alone demonstrates just how easy it is to unwittingly invest in an area with little or no demand from renters.
That’s why we only consider investing in suburbs with a minimum of 30% renters present (to 70% maximum). It’s all about maximising the demand potential for tenants and minimising the risk.
We regularly purchase and recommend expert property reports from providers like SQM Research, Core Logic RP Data, Terry Ryder’s Hotspotting, Ripehouse and Location Score.
The single most important thing about using any expert reports is that the suburbs you consider are matched to your property investment strategy and personal criteria.
To help with this, we have built and developed our own custom software called the Suburb Selector Software.
The Suburb Selector Software analyses suburbs from any source, based on your individual criteria. In less than 60 seconds, the software eliminates unsuitable suburbs, leaving you to concentrate on the most viable candidates.

This is all about understanding the needs and desires of the demographic in the areas you’re considering. As in step 3, doing so will enable you to maximise demand and minimise risk.
One of the first things I like to look at is housing stock. What kinds of houses are the most in-demand in the area?
Is it houses or units? Three-bedroom houses or four-bedroom houses?
What is the typical property?
This is all about minimising risk by only purchasing the typical property type for the area (that is matched to your strategy).
When it comes time to sell, this means you will be selling an in demand property.
Who are the people that live in the area?
Look at each location and determine whether or not the people living in an area are a match for your chosen strategy.
What is the percentage split between retirees, school and university students, and families (as they are all seeking different types of accommodation)?
What’s the median age?
Is there a high percentage of people at university? If so, this might be the opportunity to create a share house or even furnishing the rooms to get a higher rental return.
If there is a higher percentage of couples with young children, then proximity to a primary school is important. And if families (mum, dad and the kids) is your target market, then you might be looking for a property with a fence for a bit of security. You might be looking at the kitchen at the back of the house with a window so mum can watch the kids out the back.
Once we fully understand the needs and desires of the demographic in the area, we can maximise the demand and minimise our risk.
It’s important to keep in mind that renters will also look for a specific set of criteria in the properties they choose. Get this set of criteria right and the demand from tenants will always be strong.
Consider the following:
Quick tip: In their advertisements, real estate agents will use descriptions like “on the right side of the highway,” in the “golden triangle” and so on. So, if you don’t know an area, you can quickly work out where the right side of town is.

The fifth and final step for investing with maximum confidence and minimal risk is protecting your cash flow.
We achieve this by only choosing suburbs with a high rental demand, a good weekly income, a good rental yield and a low vacancy rate!
The most reliable way to measure rental demand is vacancy rates.
It’s generally assumed that if the vacancy rates are at 3%, it means there are as many people looking to rent.
When vacancy rates are at 3%, it means the supply and demand are equal. In other words, the market is in equilibrium.
It’s prudent, therefore, to minimise risk by setting an upper limit of 3% for vacancy rates.
Rental yield is calculated by taking the annual rent and dividing by the property price, i.e. $15,000 per year / $300,000 means the rental yield is 5%.
Like most of the statistics mentioned above, you can find rental yield listed in the back of Your Investment Property magazines.
Rental yield is only part of the story. The total yield is what really counts, i.e. the rental yield plus the capital growth %.
Many investors are willing to sacrifice a high rental yield for capital growth. For example, they might accept a rental yield of 3% if they know the capital growth will be at or above 8%.
We advocate for having both by selecting a high growth area and then manufacturing higher rental yield through strategies like strategic renovation.
For more on strategic renovation, see case study here.
My rental yield filter is if the suburb outperforms (at a minimum) the average rental yield across the metro area.
Weekly income changes from state to state and suburb to suburb. Where this metric really becomes relevant is when choosing between a final list of suburbs.
Weekly income is one of those things that might tip one suburb over another as your first choice.
There are over 15,700 suburbs in Australia.
Of those suburbs, only 2,384 (or just 15%) make it through my first-pass investment filter.
Today, with advances in technology, I have the ability to perform filtering like this in seconds (not days).
First-pass criteria:
Above is the first-pass criteria we use for our clients and ourselves for a capital growth strategy. Suburbs that do not meet the criteria are eliminated immediately from the search.
The technology, data and training we have access to nowadays is better than it has ever been before. Right now we have access to amazing tools and training.
The challenge is other investors have access to these tools too. So in order to keep ahead of the market (and not behind) we must have a clear understanding of what the data is telling us.
One of the biggest challenges facing investors today is having the time to do all of the necessary manual research.
Using technology to find investment-grade areas that are aligned to your criteria can help you reach financial freedom a lot sooner and with much less risk.

A Powerful Guide to Systematically Find Investment Properties in High-Growth Areas
FREE WEBINAR REVEALS: